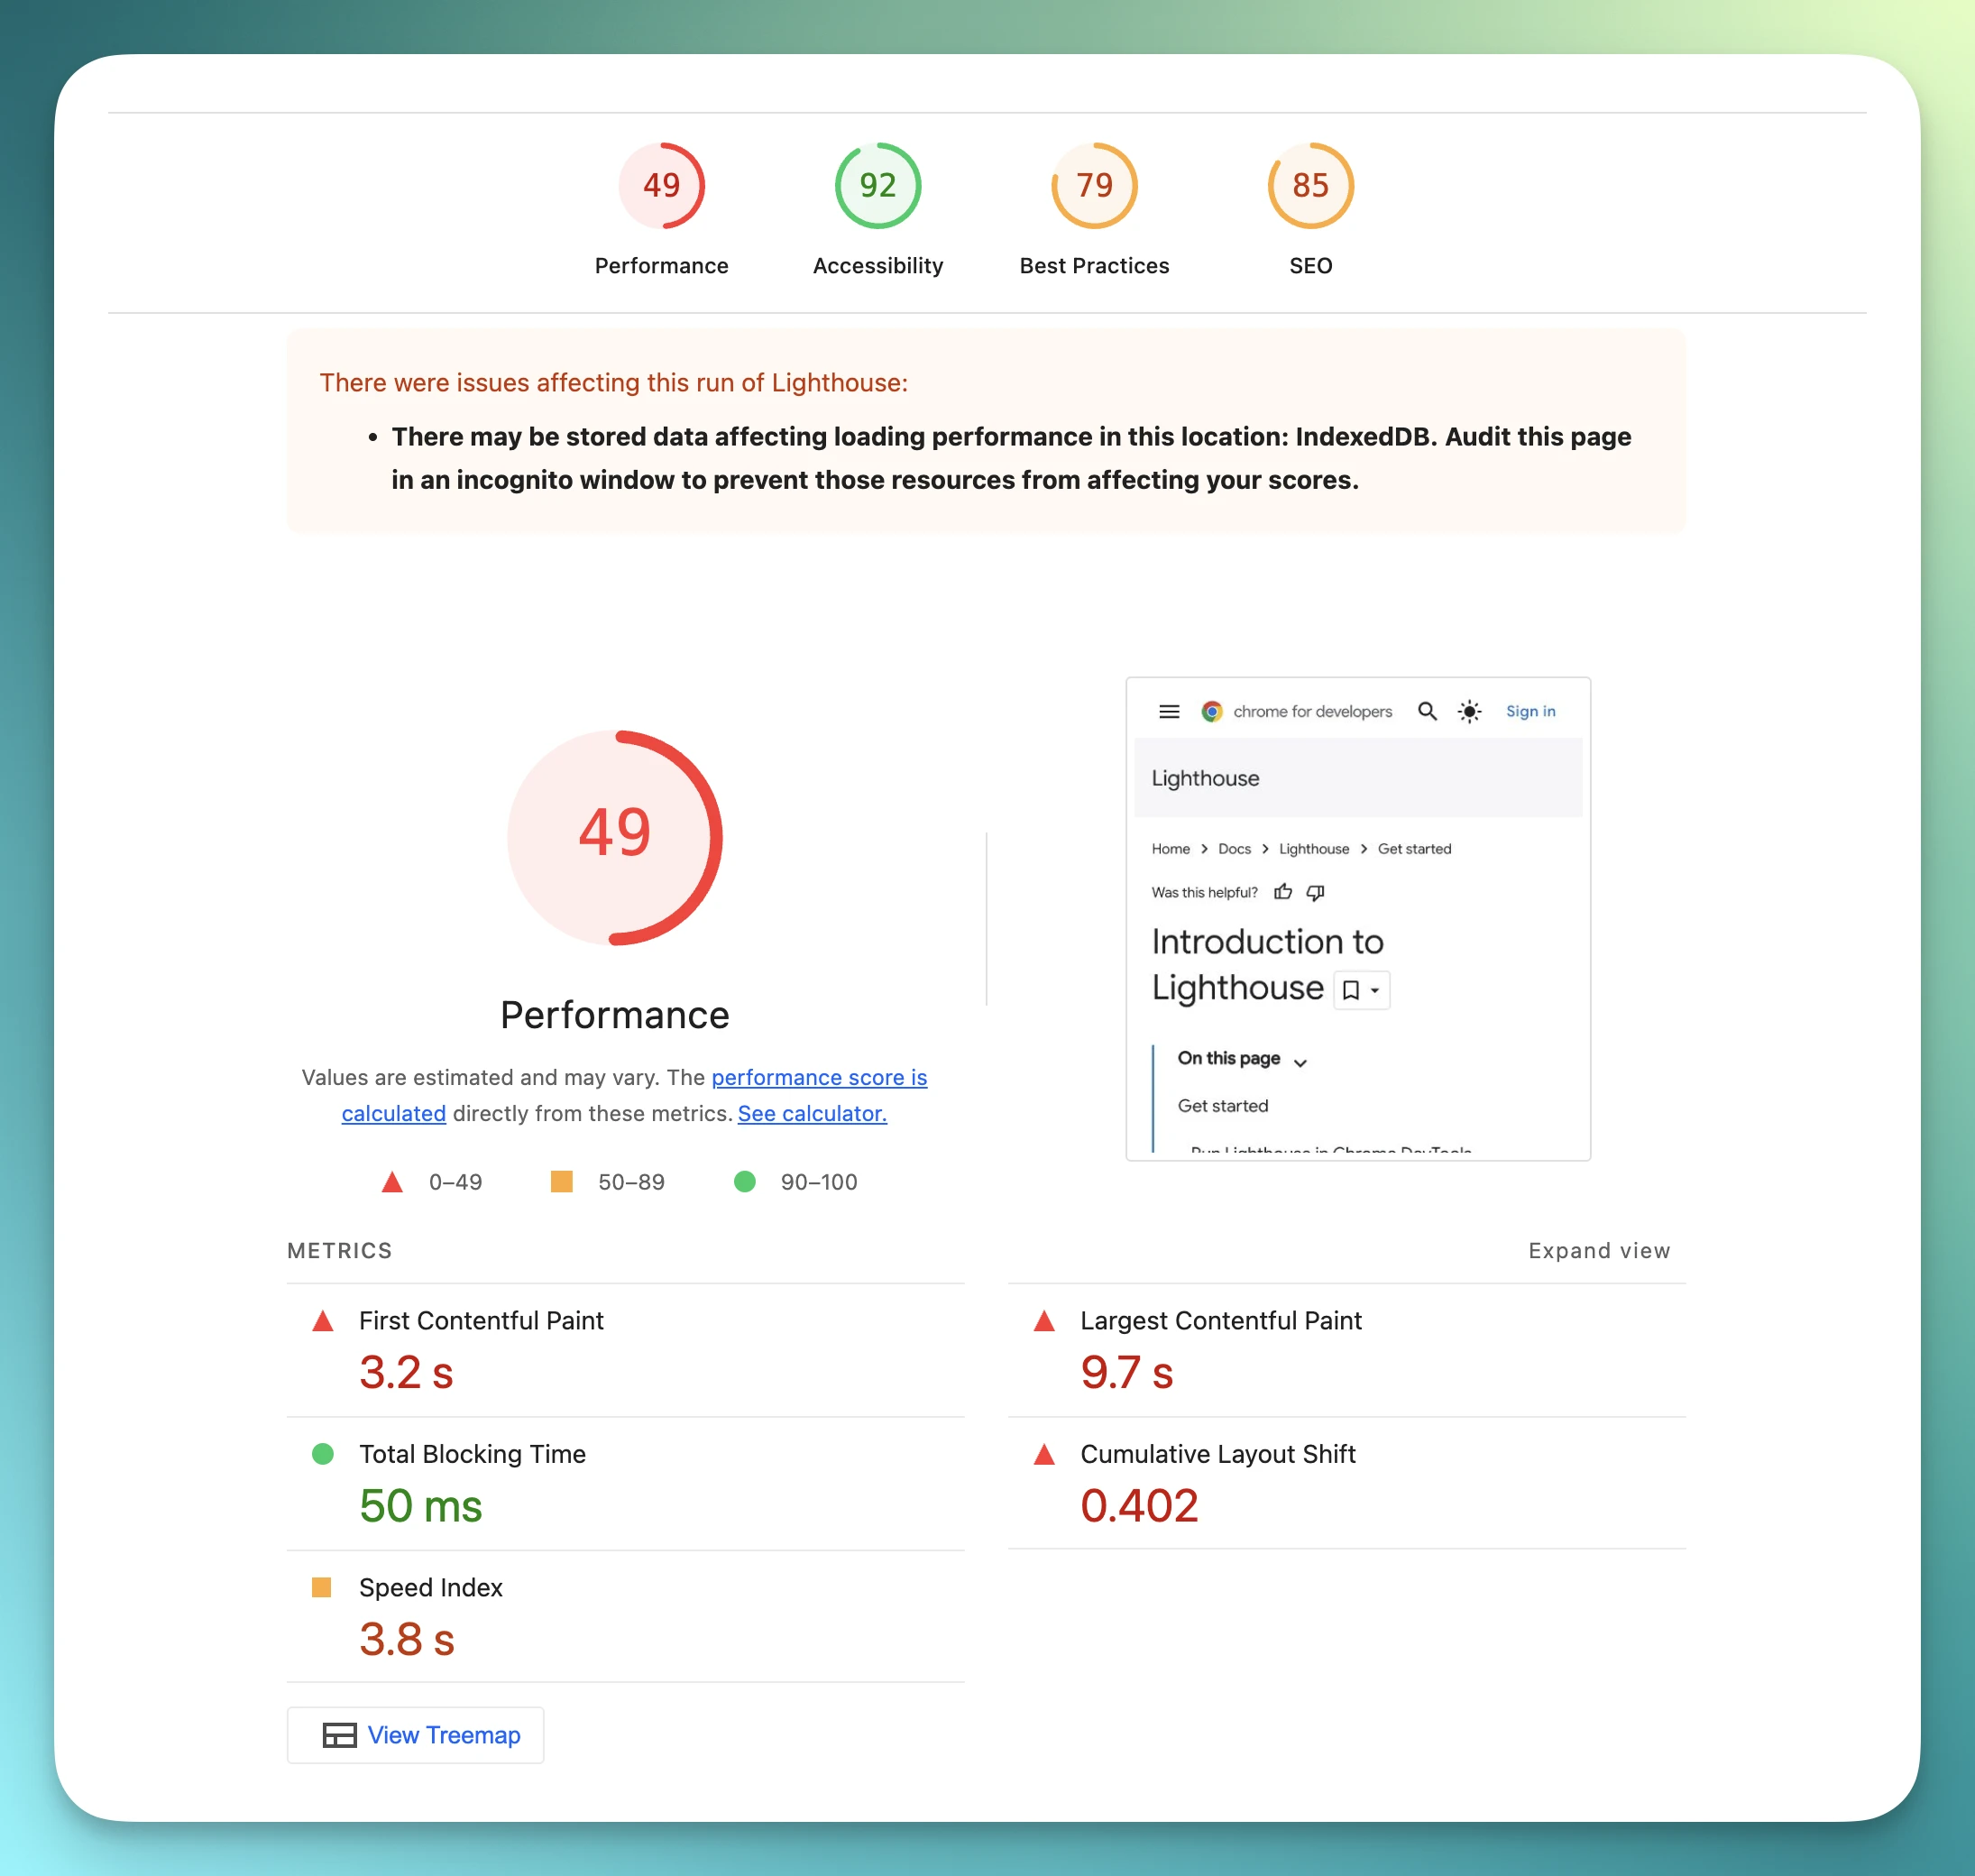
Lighthouse is Google’s open-source performance tool built into Chrome that scores pages from 0 to 100. A score between 90 and 100 means your site loads fast, responds to clicks, and stays visually stable during load — but scores vary widely across real-world mobile pages, depending on page type, scripts, images, and testing conditions.
Lighthouse evaluates pages across four categories — Performance, Accessibility, Best Practices, and SEO — each with its own 0–100 score. The Performance score is what most teams focus on. Page speed affects bounce rate, user experience, and conversions, which is why checking performance across your whole site matters.
Chrome DevTools is useful for checking one page. But if you manage a marketing site with dozens or hundreds of pages, the bigger problem is knowing which page scores dropped, which regressions appeared after an update, and whether the whole site is in good shape.
This guide covers what each score range means, which metrics to fix first, and how to move beyond one-page DevTools checks to testing your entire site.
How Lighthouse Measures Performance and Calculates Scores
Lighthouse runs performance tests by simulating how a web page loads on a mid-range mobile device with a slow 4G network — with throttled CPU and network conditions that reflect real-world constraints. It captures timing data for key user experience moments: when content first appears, when users can interact with the page, and how stable the layout stays during load. Because it runs in a controlled environment, results reflect a specific test scenario rather than live user behavior, which is why scores can fluctuate between runs.
Core Web Vitals Overview
Core Web Vitals are three metrics that measure key aspects of user experience:
- Largest Contentful Paint (LCP): Measures how long it takes for the largest visible element (like a hero image or heading) to load on screen. Good: 2.5s or less.
- Total Blocking Time (TBT): Measures total time the main thread is blocked and can’t respond to user input. Lighthouse uses TBT as its lab-based measure of interactivity — a proxy for how quickly pages feel responsive. Good: 200ms or less.
- Cumulative Layout Shift (CLS): Measures how much elements move around during page load. Good: 0.1 or less.
| Metric | Good | Needs Improvement | Poor |
|---|---|---|---|
| LCP | ≤2.5s | 2.5s–4.0s | >4.0s |
| TBT | ≤200ms | 200ms–600ms | >600ms |
| CLS | ≤0.1 | 0.1–0.25 | >0.25 |
Source: Google’s Core Web Vitals thresholds
Lighthouse Performance Score: How the Weighting Works
Lighthouse generates a performance score from 0 to 100 based on a weighted average of individual metrics:
| Metric | Weight |
|---|---|
| Largest Contentful Paint | 25% |
| Total Blocking Time | 30% |
| Cumulative Layout Shift | 25% |
| First Contentful Paint | 10% |
| Speed Index | 10% |
What the score means in practice:
- 0–49 (Red / Poor): Significant performance issues. Most users will notice slow loading and may leave before the page finishes.
- 50–89 (Yellow / Needs Improvement): Room for optimization. Users may experience minor delays on slower connections.
- 90–100 (Green / Excellent): Fast, stable, and responsive. This is the target for sites where performance affects conversions.
Where a site lands depends on page type, third-party scripts, and image sizes. A lightweight marketing page and a script-heavy app can differ by 30 or more points. LCP and TBT together account for 55% of the score, so if you’re trying to move the needle quickly, these two metrics give you the best return on effort.
Why Lighthouse Scores Fluctuate (and How to Get Consistent Results)
If you’ve run Lighthouse tests multiple times on the same page, you’ve probably seen scores vary between runs. This is expected behavior, as documented in Lighthouse’s variability guide:
- Network conditions: Even simulated network speeds can fluctuate slightly between runs.
- Device performance: Background processes on your testing device can slow page execution.
- Browser extensions: Extensions can inject scripts or modify requests, interfering with measurements.
- Server variability: Server response times change based on traffic, caching, or backend load.
- Testing environment differences: Tests run locally in Chrome DevTools versus remote services like PageSpeed Insights may produce different results.
To get more consistent Lighthouse scores:
- Run tests in incognito mode to avoid browser extension interference
- Close unused applications before testing
- Run three tests and use the median score
- Use the same testing method and device for every comparison run
Small fluctuations of 2–5 points are normal. Focus on changes larger than 10 points and on directional trends over time rather than single-run numbers.
How to Run Lighthouse Tests On a Single Page: DevTools, CLI, and More
You can run Lighthouse using several methods depending on your workflow. Each uses the same underlying engine but differs in how tests are triggered and what pages they can reach.
DevTools Approach
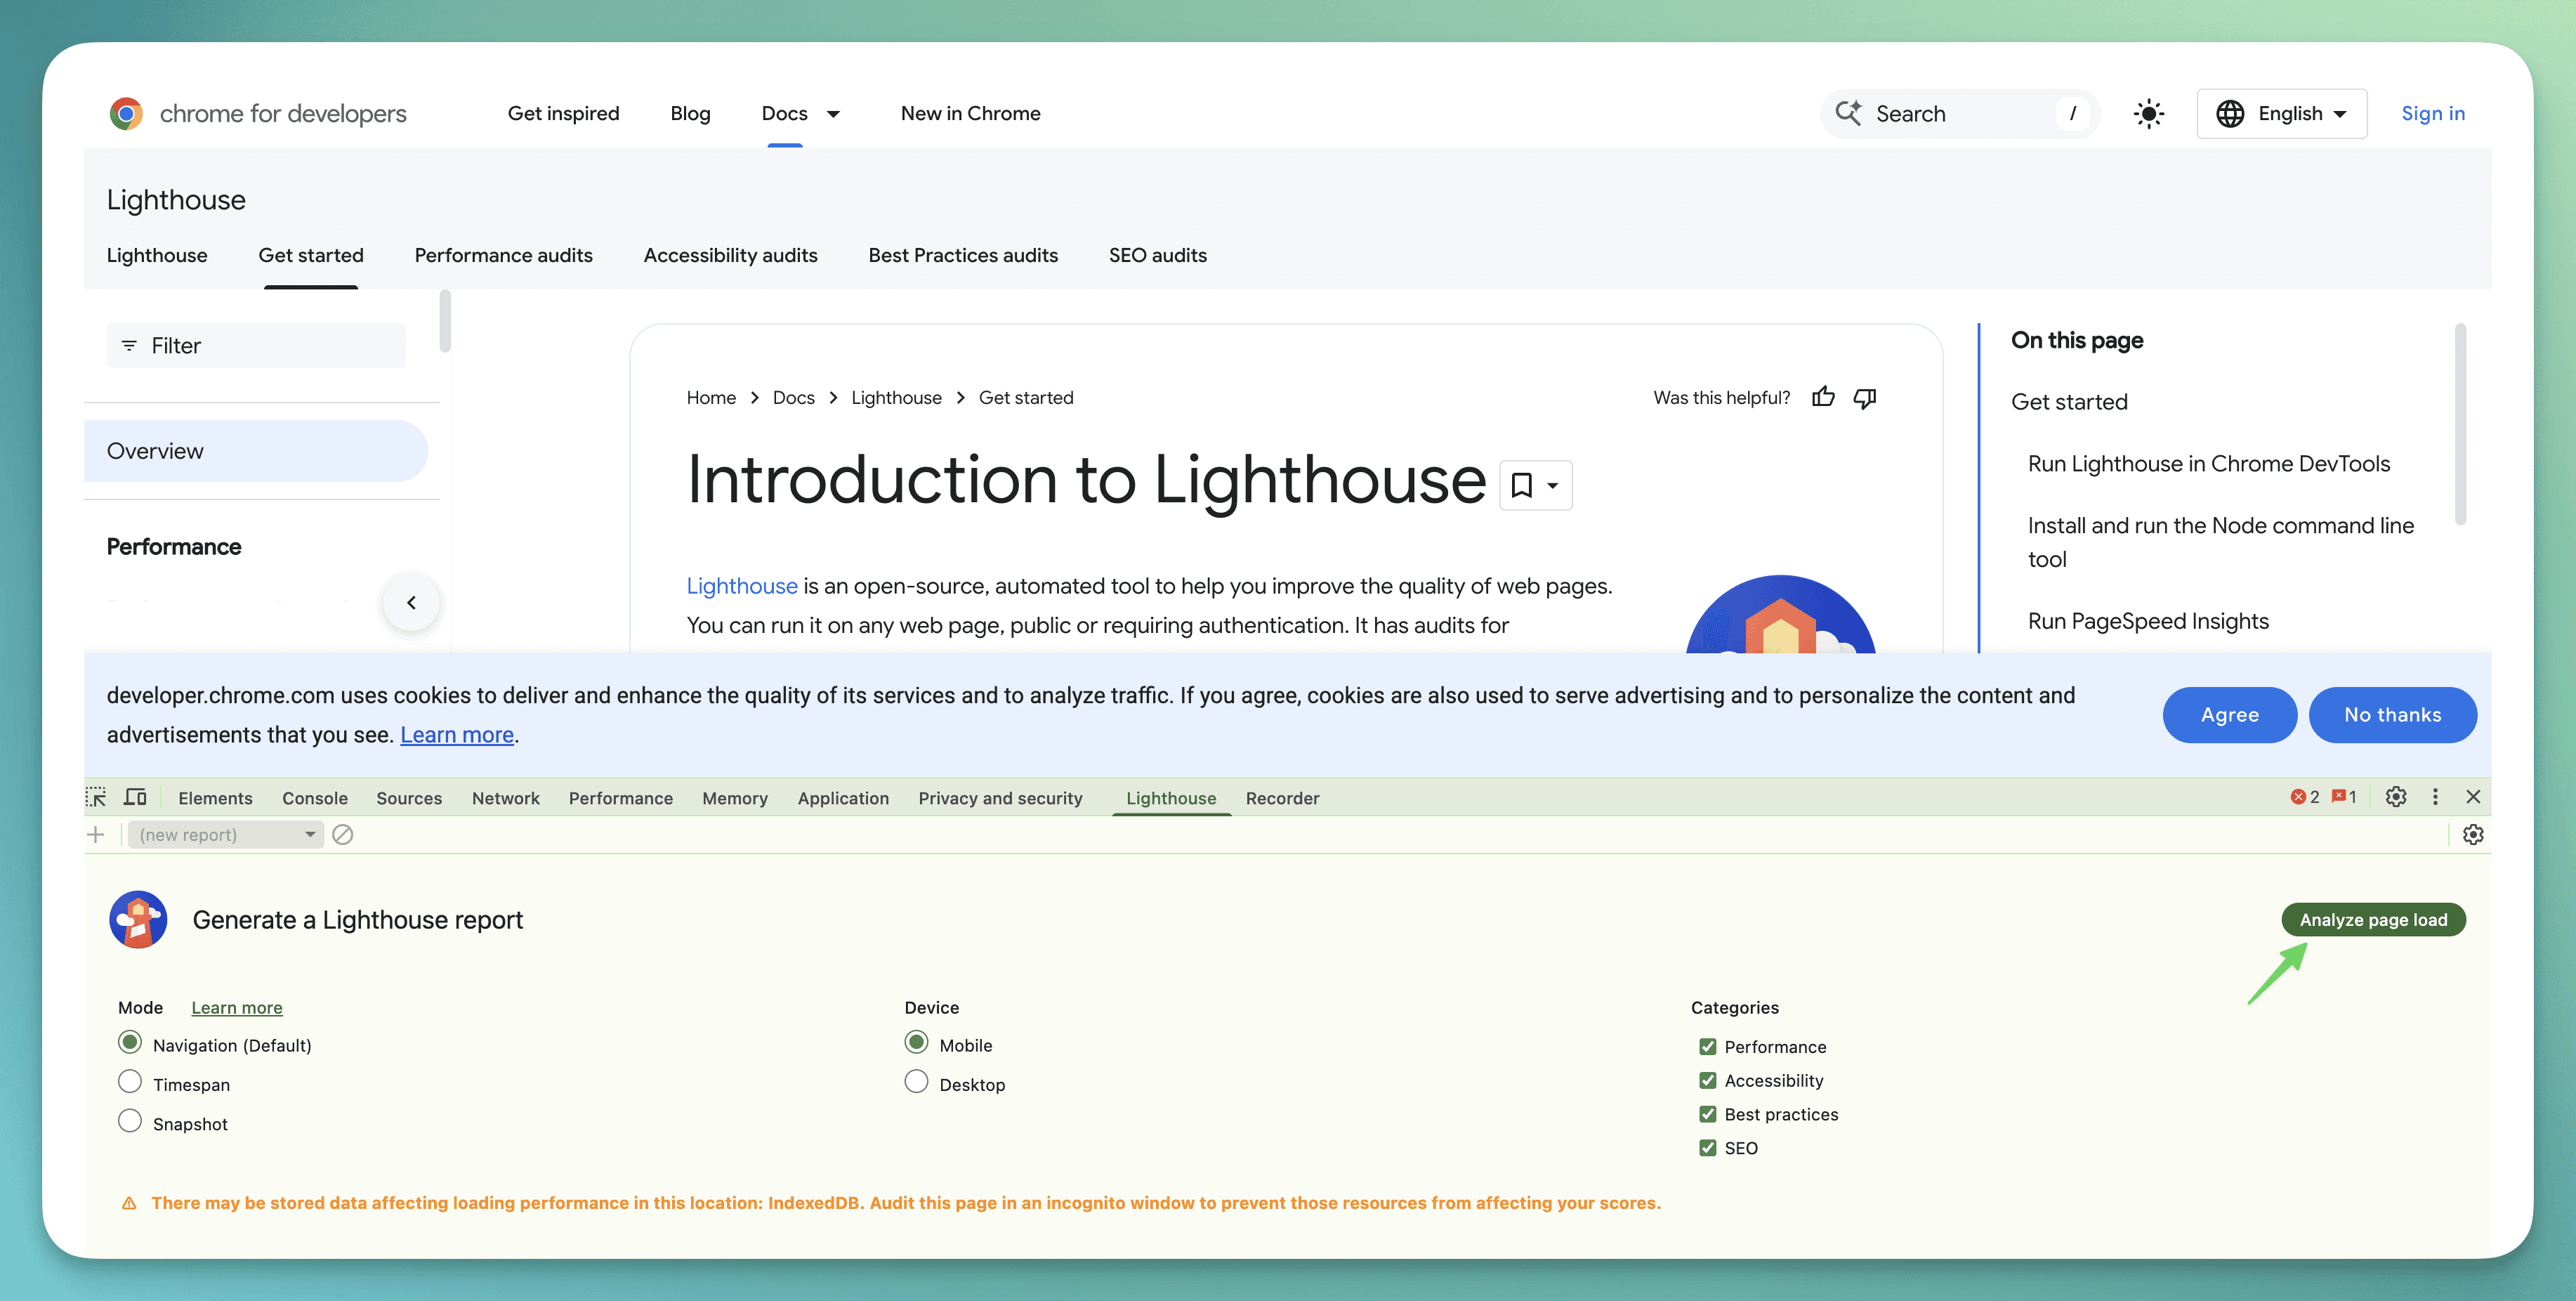
Chrome DevTools provides the most accessible way to run Lighthouse:
- Open Chrome and navigate to the page you want to test
- Right-click and select “Inspect” or press Ctrl+Shift+I (Windows/Linux) or Cmd+Option+I (Mac)
- Click the “Lighthouse” tab (you may need to click ”>>” first if it’s not visible)
- Select device type (mobile or desktop) and categories to test
- Click “Analyze page load”
- View the report when the test completes (30–60 seconds)
This method works with local development sites and pages requiring login, making it ideal for testing during development.
CLI and Node Module
For developer workflows, the Lighthouse CLI offers more control — install it with npm install -g lighthouse and run tests directly from your terminal. It supports batch testing and CI integration. For most marketing teams, DevTools or the extension is sufficient for single-page checks.
Browser Extension
The Lighthouse Chrome extension provides a quick way to run tests:
- Install the extension from the Chrome Web Store
- Navigate to the page you want to test
- Click the Lighthouse icon in the toolbar
- Select categories and device type
- Click “Generate report”
The extension cannot test local sites or pages requiring authentication. For those cases, Chrome DevTools is recommended.
How to Run Lighthouse Checks Across Your Entire Site
Most performance issues aren’t limited to the homepage. Product pages, blog posts, and landing pages often have very different performance profiles — and they don’t surface unless you check them. Scaling Lighthouse across your whole site requires either a CI/CD pipeline or a no-code tool that handles it for you.
CI/CD Integration
For developer teams, Lighthouse CI can run automated checks in your build pipeline. For marketing teams managing Webflow or Framer sites, this is usually more setup than you need — the no-code option below is faster to get running.
No-Code Option: Automated Checks Without a CI Pipeline
The real problem is simpler: Chrome DevTools checks one page at a time, but website updates can affect dozens or hundreds of pages.
Sitepager runs Lighthouse reports across your site without dev setup. Enter your URL, and it works through the pages it can access, including logged-in pages when login is enabled.
It also shows score changes alongside visual changes, broken links, and SEO issues, so your team can review website updates in one repeatable workflow instead of switching between tools after every publish. See how it fits into automated website testing for marketing teams.
For Webflow and Framer sites, Lighthouse fixes usually come down to what you can control: images, scripts, fonts, embeds, and animations. Server-level changes are mostly handled by the platform, so the section below focuses on practical fixes inside each tool.
Interpreting the Core Metrics in Your Lighthouse Report
Understanding what each metric is actually measuring tells you where to focus your optimization effort. Here’s what each core metric means and the most common causes of poor scores.
Largest Contentful Paint
LCP measures when the largest content element becomes visible on screen. This is typically:
- Hero images on landing pages
- Large headline text blocks
- Featured video thumbnails
- Product images on e-commerce pages
Poor LCP commonly results from:
- Large, unoptimized images
- Slow server response times
- Render-blocking resources that delay the main content
Total Blocking Time
TBT measures the total time when the main thread is blocked and can’t respond to user interactions. High TBT means the page looks loaded but doesn’t react quickly when someone clicks or taps.
Common causes:
- Heavy JavaScript execution
- Long tasks that take over 50ms
- Third-party analytics and marketing scripts running synchronously
Cumulative Layout Shift
CLS measures visual stability during page load. A high CLS score means elements move unexpectedly — text jumps, buttons shift — creating a disorienting experience.
Common causes:
- Images without explicit width and height attributes
- Ads or embeds that load late and push content down
- Dynamically injected content above existing elements
- Web fonts causing text to reflow on load
Improving Your Lighthouse Score on Webflow and Framer
Webflow and Framer handle server-level optimization — CDN, hosting, and caching — so many standard performance fixes don’t apply. The sections below focus on what you can actually control within each platform. For a full breakdown of what to check on a Webflow site beyond performance, see how to test your Webflow website: a complete guide and checklist.
Webflow Performance Optimization
Webflow users can improve Lighthouse scores within the Designer interface and hosting settings:
- Optimize images: Use Webflow’s built-in compression or upload pre-optimized WebP images before adding them to the Designer
- Enable lazy loading: Turn on lazy loading in Designer settings for images that appear below the fold
- Minimize custom code: Every third-party embed and custom HTML block adds JavaScript weight — audit what you’re actually using
- Choose lightweight fonts: Limit Google Fonts to 1–2 families and remove unused weights
- Use Webflow’s CDN: Automatically enabled for all Webflow-hosted sites
- Simplify interactions: Complex GSAP animations and Lottie files can dramatically increase TBT — test before and after adding them
Webflow’s platform handles server-side optimization for you, but image sizes and third-party scripts remain entirely within your control.
Framer Performance Optimization
Framer sites can be optimized through careful component and content management:
- Use Framer’s image optimization: Upload appropriately sized images before adding them to your design
- Limit animated components: Every animated element adds to JavaScript execution time — test pages with dense interactions separately
- Minimize external dependencies: Custom code components that pull in external libraries increase load time
- Use system fonts: Avoids web font loading delays entirely
- Reduce page weight: Fewer components and assets per page = lower TBT
How to Improve Your Lighthouse Performance Score
These strategies apply to any site. If you’re on Webflow or Framer, sections 2 and 4 (server response and CDN) are largely handled by the platform — focus on sections 1, 3, and 5.
1. Optimize Images and Media
🎯 Addresses: Largest Contentful Paint (LCP)
Images often account for the largest portion of page weight. Optimizing them can significantly improve loading speed and LCP.
Quick wins (0–2 hours):
- Use TinyPNG or Squoosh to compress existing images
- Convert images to WebP format using Convertio or Cloudinary
- Add
loading="lazy"to images below the fold
Advanced optimizations (2–8 hours):
- Implement responsive images with
srcsetattributes - Use Imagemin for automated compression in your build pipeline
- Set up Cloudinary or Imgix for dynamic image optimization
Example responsive image code:
<img src="image-800w.webp" srcset="image-400w.webp 400w, image-800w.webp 800w" sizes="(max-width: 600px) 400px, 800px" alt="Product photo" loading="lazy" width="800" height="600">2. Reduce Server Response Times
🎯 Addresses: Largest Contentful Paint (LCP)
A slow server response delays everything else. Time to First Byte (TTFB) should be under 200ms for optimal performance according to Google’s TTFB recommendations.
Quick wins:
- Enable gzip compression
- Use Cloudflare free plan for basic CDN
- Implement browser caching per GTmetrix recommendations
Advanced optimizations:
- Upgrade to faster hosting (consider Vercel, Netlify, or DigitalOcean)
- Implement Redis caching with Redis Cloud
3. Minimize JavaScript Blocking
🎯 Addresses: Total Blocking Time (TBT)
JavaScript can block rendering and interaction, increasing both LCP and TBT.
Quick wins:
- Add
deferattribute to non-critical scripts - Use Chrome DevTools Coverage tab to find unused code
- Use Lighthouse Treemap to visualize unused JavaScript
- Use Chrome DevTools Performance tab to identify tasks over 50ms
- Remove or defer non-essential third-party scripts (chat widgets, social media embeds)
Advanced optimizations:
- Implement code splitting with Webpack or Rollup
- Use Partytown for Google Analytics and marketing scripts
- Consider React.lazy() for component-level splitting
Example of proper script loading:
<!-- Critical script loaded normally --><script src="critical.js"></script>
<!-- Non-critical scripts deferred --><script src="analytics.js" defer></script><script src="features.js" defer></script>
4. Leverage Caching and CDNs
🎯 Addresses: Largest Contentful Paint (LCP), faster loading for returning visitors
Proper caching reduces server load and speeds up repeat visits significantly.
Quick wins:
- Set up Cloudflare free CDN (30 minutes setup)
- Enable browser caching through server configuration
- Use the CDNPlanet CDN Performance Check to verify caching and CDN delivery
Advanced optimizations:
- Implement service workers using Workbox
- Set up Amazon CloudFront for global distribution
5. Fix Cumulative Layout Shift
🎯 Addresses: Cumulative Layout Shift (CLS)
To prevent elements from shifting during page load:
- Always specify
widthandheightattributes for images and videos - Use
font-display: swapin CSS - Reserve space for ads using CSS
min-height - Follow Google Fonts optimization techniques to prevent text reflow
Next Steps for a Complete Lighthouse Performance Strategy
Lighthouse gives you the data. Acting on it consistently is what actually moves scores.
- Establish baselines first. Run Lighthouse on your key pages and record current scores before making any changes. You need a before to have an after.
- Set realistic targets. If you’re at 55, aim for 70 before aiming for 90. Small, measurable improvements are faster to validate.
- Fix by impact, not by order. LCP and TBT account for 55% of your score. Start there, not with Speed Index or First Contentful Paint.
- Test changes in staging before publishing. A fix that improves LCP can introduce CLS if applied carelessly.
- Test beyond your homepage. Your homepage may score 85 while product pages or blog posts sit at 45. The only way to know is to check them.
- Make testing a repeatable part of your update workflow. A site that scores 90 today can drop to 70 after a major content update. Schedule regular checks rather than testing only at launch.
Performance is not a one-time fix. As your site evolves — new pages, new third-party scripts, new images — new issues will surface. Google found that sites meeting Core Web Vitals thresholds were 24% less likely to have users abandon page loads. The teams that see those results run checks consistently, not occasionally.
Frequently Asked Questions About Lighthouse Testing
What is a Lighthouse audit and what does it measure?
A Lighthouse audit is an automated performance test that simulates how your web page loads on a mid-range mobile device with a slow 4G connection. It measures five metrics — Largest Contentful Paint (LCP), Total Blocking Time (TBT), Cumulative Layout Shift (CLS), First Contentful Paint (FCP), and Speed Index — and produces a score from 0 to 100. LCP, TBT, and CLS carry the most weight (80% combined). A score of 90 or above is considered excellent; scores vary widely depending on page type, scripts, and images.
What’s the difference between Lighthouse and PageSpeed Insights?
PageSpeed Insights uses Lighthouse as its underlying engine for lab data, but adds real-user metrics from Google’s Chrome User Experience Report (CrUX). This means PageSpeed Insights shows you both what Lighthouse measured in a controlled test and how real users have actually experienced your page over the past 28 days. If you’re debugging a specific issue, use Lighthouse directly — the simulated environment is more consistent than field data for optimization work.
How can I test my website’s performance in different geographic locations?
Lighthouse itself tests from wherever your device or server is located. If your site serves visitors in multiple regions — different CDN edge locations, localized content, or geo-targeted pricing — your performance profile may vary significantly by country. To test from specific locations, you need a tool that runs tests from remote infrastructure. Sitepager lets you select your testing region, which helps evaluate CDN effectiveness and catch server response issues that only appear for users in certain areas. For more on managing location-specific website behavior, see the geolocation testing guide for websites.
Should I fix every issue Lighthouse identifies?
No. Lighthouse reports dozens of opportunities and diagnostics, but not all of them affect your score meaningfully. Prioritize by impact: fix LCP and TBT issues first, since they account for 55% of your score. CLS fixes come next. Speed Index and First Contentful Paint together account for only 20% — address them after the higher-weight metrics are handled. For each recommendation, Lighthouse estimates the potential score improvement.
How often should you run Lighthouse checks on your website?
Run a Lighthouse check after any significant update — new page templates, major image changes, new third-party scripts, or CMS content migrations. For high-traffic pages, run on a weekly or bi-weekly schedule to catch regressions before they affect real users. For a full site, monthly scheduled checks give you a baseline to compare against. Performance scores drift over time as sites grow — a page that scored 88 at launch can drop to 65 after six months of added content and scripts. Scheduled checks make that drift visible before it becomes a problem.
Can Lighthouse test authenticated or dynamic pages?
Yes. Chrome DevTools can test any page you’re already logged into. Open the page in Chrome, stay signed in, and run the Lighthouse audit from DevTools.
For sitewide authenticated testing, Sitepager can handle this without manual setup. When login is enabled, Sitepager logs in first and then runs the scan from that authenticated session. That means it can capture screenshots, run page checks, and generate Lighthouse reports for logged-in pages it can access after login.